 StockPets
STORIES FROM THE FARM
Loss Aversion and Overtrading: Why StockPets Moves One Month Every 8 Hours
· The StockPets team
Most people feel a loss more sharply than a gain of the same size. Look at your results often enough and that imbalance adds up to a steady feeling that things are going badly, even in a year that ends higher. Here is what the research says, and why StockPets is built around a slower calendar.
Short answer
Loss aversion means losses weigh roughly twice as much as equal gains; Tversky and Kahneman’s 1992 estimate was 2.25. Checking results often — myopic loss aversion — means seeing more losing periods and feeling worse, which can push people to trade too much. StockPets turns its pages at a gentle pace: the first 12 months move freely, then one calendar page (one month) refills every 8 hours, up to 3. It is a game-design choice for calmer play, not an investment strategy or a promise of better results.
What is loss aversion?
Loss aversion is a central finding of prospect theory: the pain of losing something is larger than the pleasure of gaining the same thing. Many people turn down a coin flip that wins 120 or loses 100, even though, on average, it pays. A widely cited estimate puts the ratio at about 2 to 1.
That isn’t foolish in itself; some losses really do hurt more than gains help. The trouble begins when the same reflex is applied to every small fluctuation.
Myopic loss aversion: when you check too often
In 1995, Shlomo Benartzi and Richard Thaler combined loss aversion with how often people evaluate their investments and called the mix myopic loss aversion. In their simulations, the large historical gap between stock and bond returns fit investors who reviewed results about once a year. Later experiments found that people who received less frequent feedback were more willing to take on long-term risk.
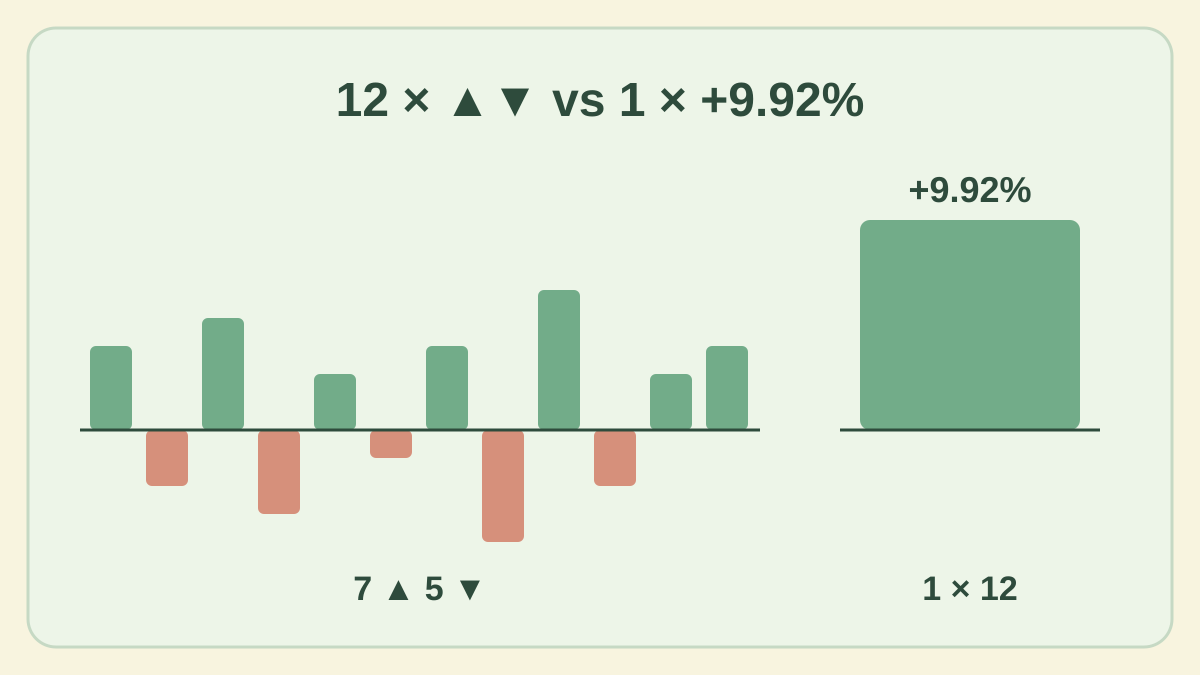
Here is a hypothetical year of 12 monthly returns, in percent: +3, −2, +4, −3, +2, −1, +3, −4, +5, −2, +2, +3.
| How you look | What you see | Felt result (losses weighted ×2) |
|---|---|---|
| Every month | 7 up months, 5 down months | 22 − (12 × 2) = −2 |
| Once, at year end | One year, +9.92% | +9.92 |
Same 12 months, same ending. Only the viewing frequency changed. Counted month by month with losses weighted double, the year feels slightly negative; seen once, it is a clear gain. This is a simplified illustration, not a model of any real portfolio.
Overtrading: when discomfort turns into taps
Feeling bad often can lead to doing something often. Brad Barber and Terrance Odean studied 66,465 US households at a discount broker from 1991 to 1996. The households that traded most earned 11.4% a year, while the market returned 17.9%. Their picks before costs weren’t very different; the costs of frequent trading created most of the gap.
Real trading comes with commissions, spreads and taxes that a game doesn’t have. Even so, the habit of reacting to every move is worth noticing — and a game is a low-stakes place to notice it.
Why StockPets moves at the pace it does
StockPets is a pet and farm game built on real US stock market history from January 1996. One turn is one month, and time only moves when you choose. The pacing rules are simple:
- The first 12 months move as fast as you like, so you can learn the game.
- After that, one calendar page (one month) refills every 8 hours, and you can hold up to 3.
- You can turn one month or three months at once.
- Free basic care — Feed, Play and Clean — can be included automatically when you turn several months.
- Nothing loses value while the app is closed.
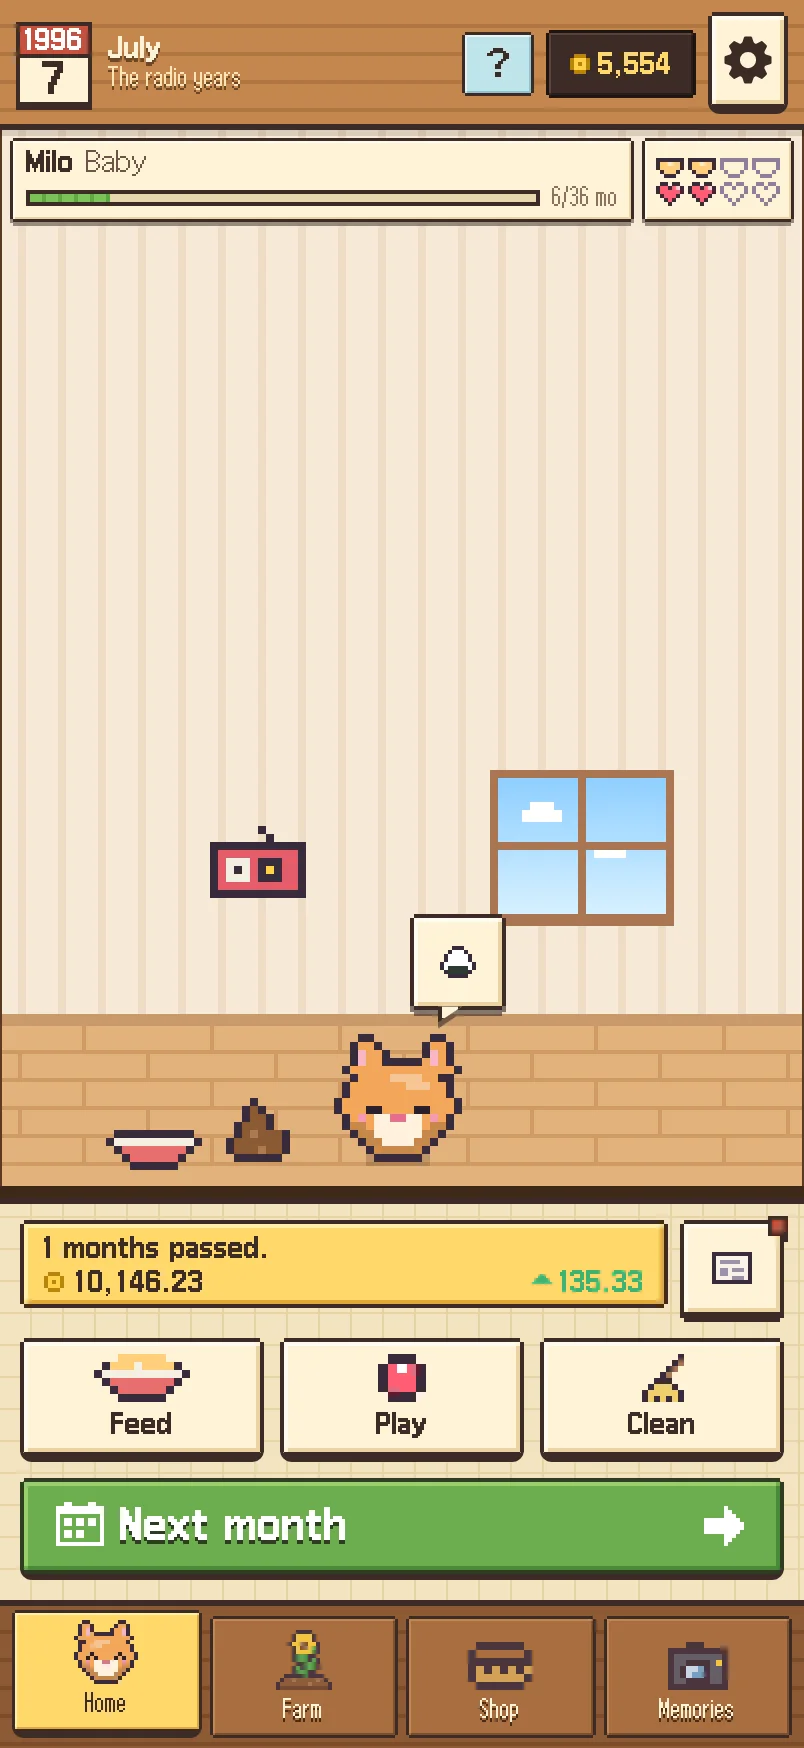
Because prices change only once a month, there is no live ticker to stare at. Between pages there is still plenty to do: feed and play with your pet, decorate the house, read the month’s little life event. The 8-hour rhythm also means a crisis like 2008 unfolds over days of real time instead of a few frantic taps.
What a slower game can and can’t teach
A game can’t remove loss aversion, and slowing down doesn’t guarantee better results, in the game or in real life. What it can do is let you watch your own reactions: whether you harvest after every red month, whether you rush to plant after a strong one, and how a stormy stretch looks once you see the whole year. Your pet never dies from market losses, so a rough stretch becomes a memory rather than a game over — see how your pet grows.
If you are comparing practice tools, our simulator checklist for beginners and StockPets vs paper trading apps explain where a monthly history game fits.
Sources and calculation notes
The worked examples on this page are original calculations using the stated hypothetical values.
- Benartzi & Thaler (1995), Myopic Loss Aversion and the Equity Premium Puzzle — NBER
- Gneezy & Potters (1997), An Experiment on Risk Taking and Evaluation Periods — Quarterly Journal of Economics
- Barber & Odean (2000), Trading Is Hazardous to Your Wealth — Journal of Finance
- Tversky & Kahneman (1992), Advances in Prospect Theory — Journal of Risk and Uncertainty
Frequently asked questions
What is loss aversion in simple terms?
Losses feel bigger than equal gains. A common estimate is that a loss hurts about twice as much as a gain of the same size pleases.
What is myopic loss aversion?
Loss aversion combined with frequent evaluation. Checking more often shows more down periods, which can make long-term risky assets feel worse than their long-run results.
Does checking my portfolio less often improve returns?
Not by itself. Research links frequent checking with less long-term risk-taking and frequent trading with higher costs, but no viewing schedule guarantees results.
How fast does time move in StockPets?
The first 12 game months are free-paced. After that, one calendar page (one month) refills every 8 hours, up to 3 pages, and you can turn 1 or 3 months at once.
Can my pet die if the market crashes?
No. Market losses can change your pet’s grown look, but they never harm it. Only a crop dies, when its company is delisted.
StockPets is a game that uses virtual coins only. Nothing on this page is investment advice, and past price changes do not predict future results.