 StockPets
STORIES FROM THE FARM
What Was $100 in 1996 Worth in 2025? Inflation and Purchasing Power Explained
· The StockPets team
A movie ticket, a bag of groceries or a paycheck from 1996 can’t be compared with today’s numbers at face value, because the measuring stick itself has changed. Inflation is that stretching of the stick. Once you can convert old dollars into today’s, historical prices — and historical returns — start to read very differently.
Short answer
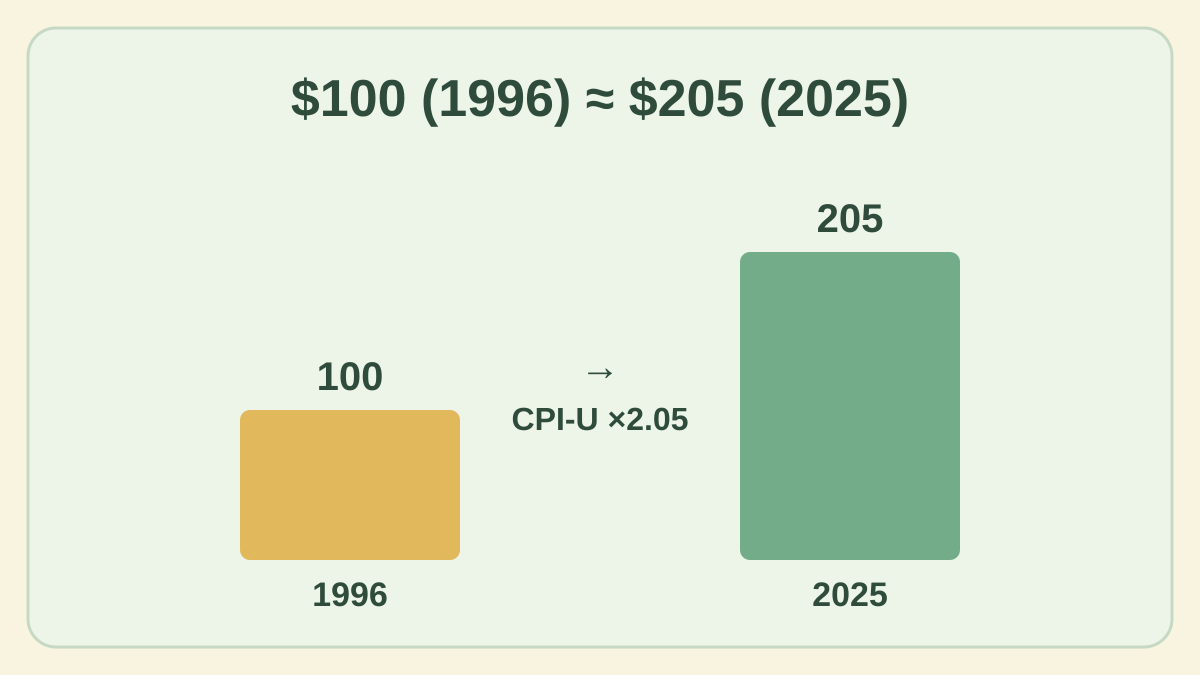
Using the US Consumer Price Index (CPI-U annual averages: 156.9 in 1996 and 321.943 in 2025), prices rose about 2.05 times, so $100 in 1996 bought roughly what $205 bought in 2025 — about 2.5% inflation a year, compounded. A return only adds purchasing power if it beats inflation. StockPets shows historical prices as they were, without inflation adjustment, so you can practice reading a 1996 farm in both nominal and real terms.
What is inflation, and how is it measured?
Inflation is a general rise in prices across an economy. In the United States, the best-known gauge is the Consumer Price Index for All Urban Consumers (CPI-U), published every month by the Bureau of Labor Statistics. It tracks the cost of a broad basket of goods and services — food, rent, fuel, medical care and more — and expresses it as an index where the 1982–84 average equals 100.
The index level on its own means little. What matters is the ratio between two dates. If the index doubles, the same basket costs twice as many dollars, and each dollar buys half as much. That second half of the sentence is what economists call purchasing power.
How do you convert 1996 dollars into today’s dollars?
Multiply the old amount by the later index divided by the earlier index. With annual averages, 321.943 ÷ 156.9 ≈ 2.05, so $100 in 1996 ≈ $205 in 2025. Read the other way around, a 2025 dollar bought about 49% of what a 1996 dollar bought.
| Year | CPI-U (annual average) | Price level vs 1996 | $100 of 1996 purchasing power |
|---|---|---|---|
| 1996 | 156.9 | 1.00× | $100 |
| 2000 | 172.2 | 1.10× | $110 |
| 2008 | 215.303 | 1.37× | $137 |
| 2020 | 258.811 | 1.65× | $165 |
| 2022 | 292.655 | 1.87× | $187 |
| 2025 | 321.943 | 2.05× | $205 |
Over those 29 years, a factor of 2.05 works out to roughly 2.5% a year, compounded. That doesn’t mean prices rose 2.5% every single year — the 2022 average alone was 8.0% higher than 2021 — but it is the steady rate that would connect the two endpoints.
Nominal return vs real return
A nominal return counts dollars. A real return counts what those dollars can buy. The relationship is multiplicative: (1 + real return) = (1 + nominal return) ÷ (1 + inflation). Simply subtracting inflation from the nominal return is a quick estimate that only works well when both numbers are small.
| Nominal return | Inflation | Real return (exact) |
|---|---|---|
| +10% | 8% | +1.85% |
| +5% | 8% | −2.78% |
| 0% | 2.5% | −2.44% |
The second row is the uncomfortable one: the balance went up, yet it buys less than before. The third row is cash left idle in a typical year. Over long periods these small differences compound just like returns do — the arithmetic is in how the rule of 72 works.
Why this matters when you read old stock prices
Historical price charts are almost always nominal. A share that went from 50 to 100 between 1996 and 2025 doubled in dollars, but with consumer prices up 2.05 times over the same stretch, its real gain on price alone is close to zero. Long-run charts make inflation invisible, which is why growth from decades ago can look larger than it felt in everyday terms.
Inflation also changes the backdrop of each era. The late 1990s had low, fairly steady inflation; 2009 saw average prices dip slightly; 2021–22 brought the highest readings in about four decades and the rate hikes covered in our 2022 replay.
Reading your StockPets farm in real terms
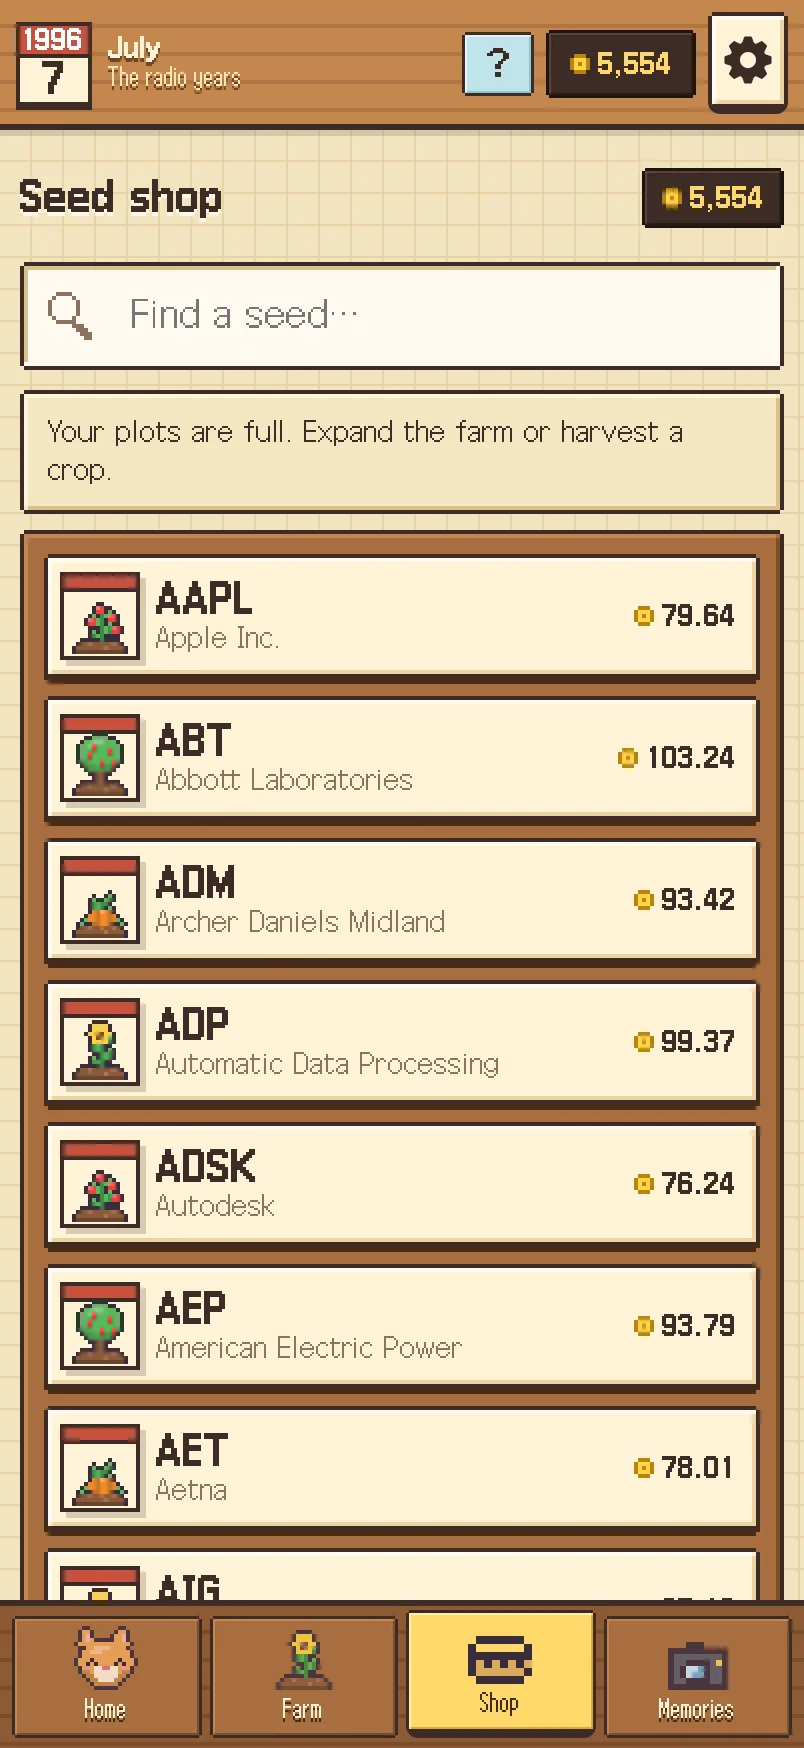
In StockPets you start in January 1996 with 10,000 virtual coins. Seed prices follow each company’s historical monthly closes, adjusted for stock splits but not for inflation or dividends, and every company starts at 100 coins in its first recorded month — see how prices become coins.
That makes the game a good place to practice the conversion above as a thought exercise. Coins aren’t dollars, and the game pays no interest on unspent coins, but if your farm reached about 20,500 coins by the 2025 pages, it would merely have kept pace with the 2.05× rise in US consumer prices. Growing well beyond that is what “beating inflation” would mean in this framing.
- Note your farm’s total value at the start of a game year.
- At the end of the year, divide the new value by the old one.
- Divide that result by the year’s CPI change (for example, 1.08 for 2022).
- Above 1 means the farm outgrew prices that year; below 1 means it fell behind.
The game itself never shows a real-terms figure, and it isn’t a measure of what any real investment returned. It simply lets you live through the decades one month at a time and ask the question yourself. For what the game does and doesn’t simulate, see learning market history with a game.
Sources and calculation notes
The worked examples on this page are original calculations using the stated hypothetical values.
Frequently asked questions
How much was $100 in 1996 worth in 2025?
About $205, using CPI-U annual averages (321.943 ÷ 156.9 ≈ 2.05). Comparing specific months gives a slightly different figure.
What has the average US inflation rate been since 1996?
About 2.5% a year, compounded, between the 1996 and 2025 annual averages. Individual years varied widely, from a slight decline in 2009 to 8.0% in 2022.
What is the difference between nominal and real return?
A nominal return counts dollars; a real return counts purchasing power. Real return = (1 + nominal return) ÷ (1 + inflation) − 1.
Are StockPets prices adjusted for inflation?
No. They follow historical monthly closing prices adjusted for stock splits only, converted to coins so each company starts at 100. Inflation and dividends are not included.
Can a positive return still lose purchasing power?
Yes. A 5% gain in a year with 8% inflation leaves you about 2.78% worse off in what your money can buy.
StockPets is a game that uses virtual coins only. Nothing on this page is investment advice, and past price changes do not predict future results.