 StockPets
STORIES FROM THE FARM
Price return vs total return: where dividends and stock splits fit
· The StockPets team
Two charts for the same company can show different long-term results without either one being a typo. One may show price changes, another may include dividends, and a third may use a different adjustment convention. The definition matters before the percentage does.
Short answer
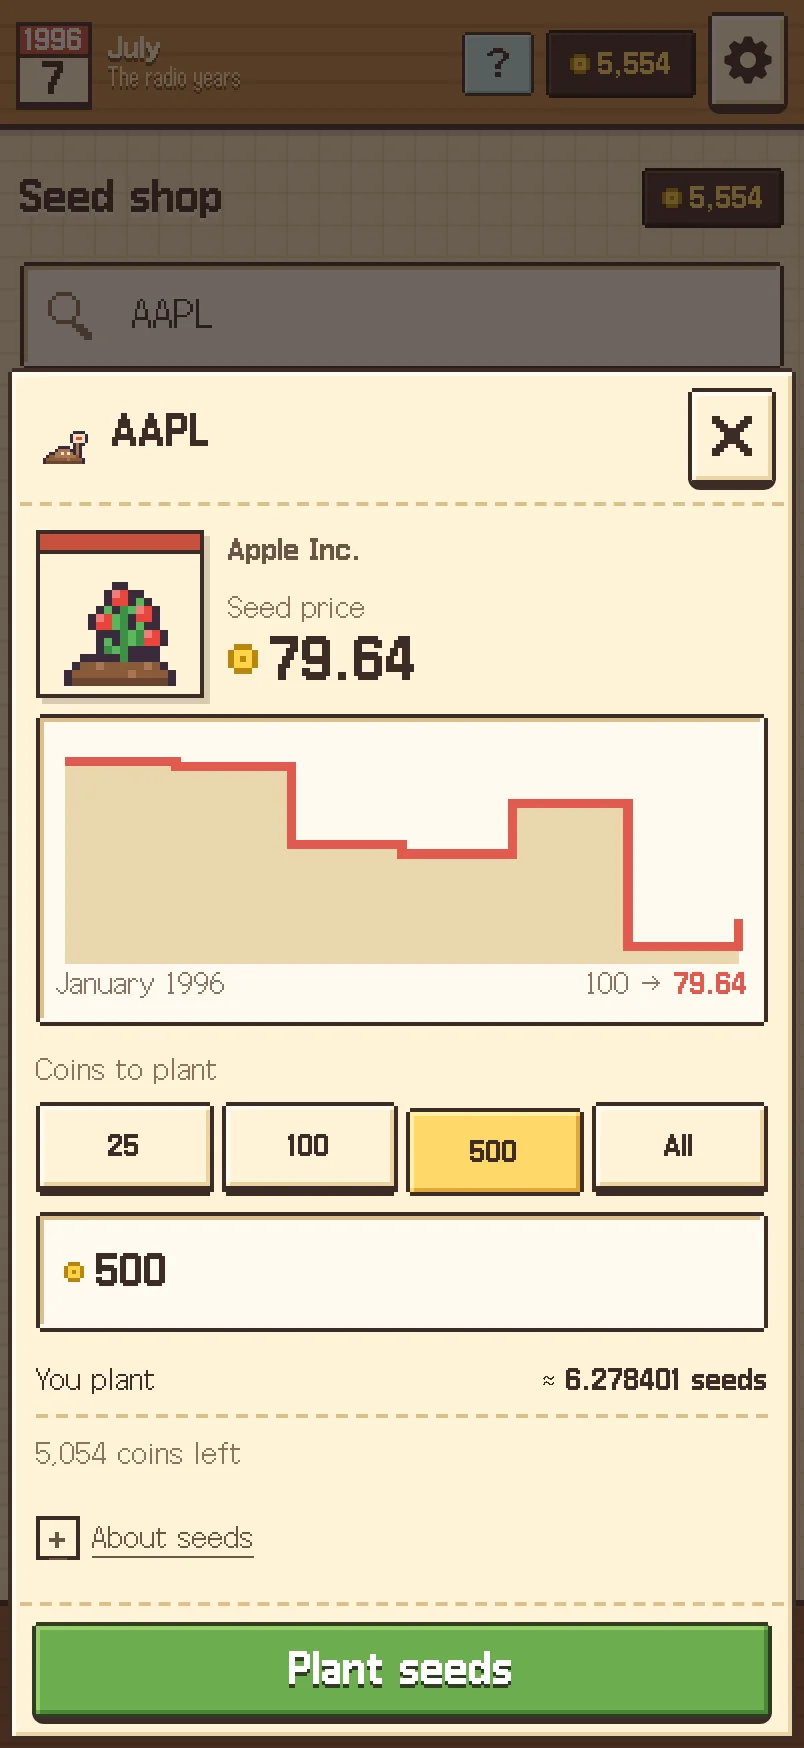
Price return measures the change in a holding’s price; total return also includes distributions such as dividends. A stock split changes share count and per-share price without, by itself, creating value. StockPets uses split-adjusted historical monthly prices, normalised to a 100-coin starting price for each series; it does not model dividend reinvestment or a total-return index.
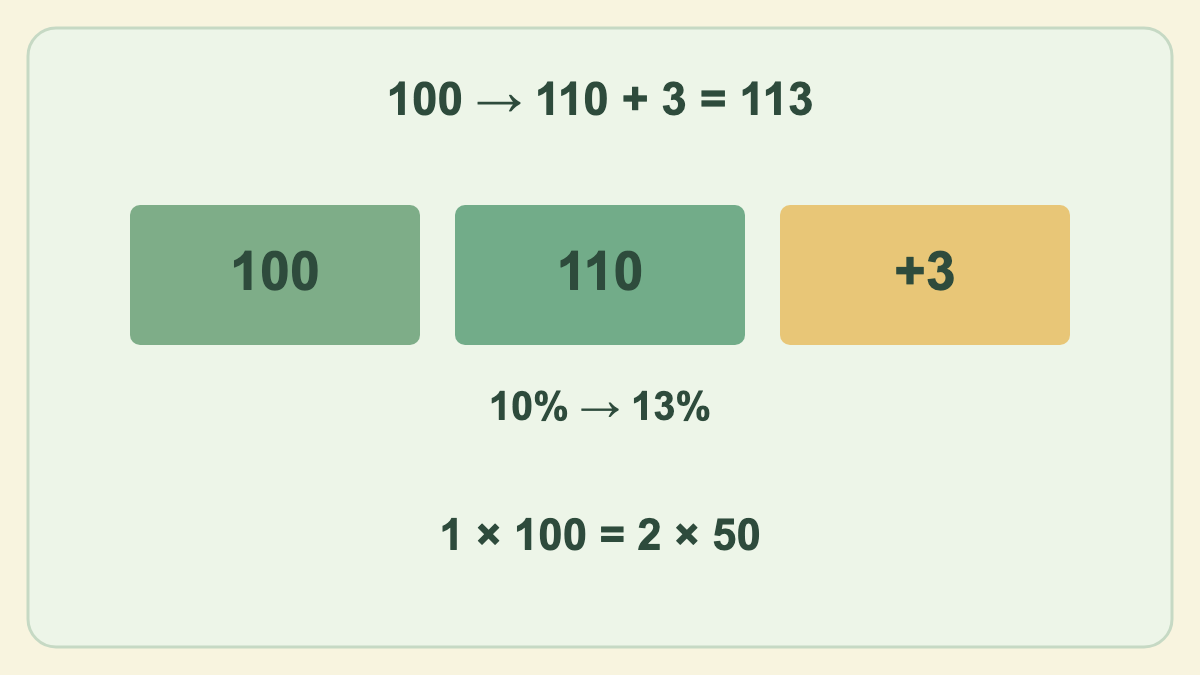
One share, two different return calculations
Suppose a share costs 100, later trades at 110, and pays a cash dividend of 3 during the period. Ignoring reinvestment, fees and tax, the price return is (110 − 100) ÷ 100 = 10%. The holding plus dividend cash is 113, so the simple holding-period total return is (110 + 3 − 100) ÷ 100 = 13%. These are hypothetical amounts, not a company’s actual history.
| Measure | Included in this example | Result |
|---|---|---|
| Price return | 100 → 110 | 10% |
| Simple total return, no reinvestment | 110 + 3 dividend cash | 13% |
| Reinvested return | Dividend buys more units when paid | Needs payment dates and reinvestment prices |
Dividends are distributions, not a promise of free extra value; prices can adjust around the ex-dividend date and companies can reduce or stop payments. Investor.gov’s stock overview explains dividends alongside the risks of stock ownership.
A two-for-one split does not double your money
If one share priced at 100 becomes two shares priced at 50, the combined value remains 100 immediately after the split, before any separate market movement. Adjusted historical prices make the earlier and later values comparable. An unadjusted chart can otherwise look like a 50% crash even though the holder received twice as many shares.
What the 100-coin price in StockPets means
The game normalises each company’s first recorded monthly price to 100 coins and follows the relative changes in its split-adjusted price series. A crop price of 100 is therefore a game unit, not a claim that a US share cost 100 dollars. Different companies can also begin their records in different months. Read the price and split guide for the conversion rules.
A game result excludes dividend cash and dividend reinvestment, as well as brokerage fees, investor tax and interest on idle cash. It should not be compared directly with a dividend-reinvested index result as though both measured the same thing. A simplified delisting rule and missing historical series are additional differences.
A checklist for comparing two historical charts
- Match the starting and ending dates, and check whether prices are daily or monthly.
- Confirm whether the series adjusts for splits only or also for dividends.
- State whether distributions remain cash or are reinvested, and at what prices.
- Match currency, fees, tax and cash flows before attributing a difference to a strategy.
The lost-decade article is a useful example of why a price-index statement needs its return definition. For purchase timing, use the staged-buying worked example, whose assumptions explicitly exclude dividends.
Sources and calculation notes
The worked examples on this page are original calculations using the stated hypothetical values.
Frequently asked questions
Does StockPets pay virtual dividends?
Its historical crop-price model does not add dividend payments or reinvest them. The series reflects split-adjusted price changes.
Does a two-for-one split double the holding’s value?
Not by itself. One share at 100 and two shares at 50 both have a combined value of 100 before other price movements.
Is a 100-coin seed a 100-dollar stock?
No. Each company’s first recorded price is normalised to 100 game coins. The later price tracks relative percentage changes.
Can I add dividend yield to price return for every period?
Only a precisely defined simple example supports that shortcut. Reinvestment, payment dates, changing prices, cash flows and tax can change the calculation.
Why can two long-term return charts disagree?
They may use different dates, currencies, dividend treatment or adjustment conventions. Check those definitions before comparing performance.
StockPets is a game that uses virtual coins only. Nothing on this page is investment advice, and past price changes do not predict future results.